
Ready to tackle the commodity market with research-driven trading strategies? We’ll give you tips on how to conduct commodity market research and execute intelligent trades.
The commodities market influences every major industry, as this is where the world’s most important resources are bought and sold. A little commodity market research can go a long way to figuring out this market, giving you the knowledge and tools needed to tackle commodity trades with confidence.
Read on to learn essential global commodity research methods.
Content
Key takeaways
- Commodity market research is essential for understanding how global markets operate. It helps traders analyze how raw materials are traded and identify opportunities across both physical and virtual markets.
- Global commodity research focuses on supply, demand, and macroeconomic factors. Inflation, GDP, weather conditions, and geopolitical events all play a major role in shaping commodity prices.
- The best commodities research combines fundamental insights with technical analysis. Using both economic data and price charts provides a clearer view of short-term movements and long-term trends.
- Technical commodity market research helps traders identify patterns and market trends. Indicators and historical price data allow traders to spot entry and exit points more effectively.
- Applying commodity market research requires strategy, discipline, and risk management. A solid trading plan, proper position sizing, and consistent analysis are key to executing successful trades.
Capitalize on market trends
Trade metals and energy price movements with low, stable spreads.
What is a commodity market?
A commodity market is a place where raw materials are bought and sold. These markets form the foundation of global economies, consisting of everyone from manufacturers that purchase for production to derivative traders seeking to profit from price movements.
There are two main categories of commodities:
- Soft commodities: These are agricultural products like wheat, coffee, corn, rice, sugar, and soybeans.
- Hard commodities: These are natural resources, including metals like gold, silver, platinum, and copper, as well as energy resources like oil and gas.
Believed to date back thousands of years to the Sumerian civilization, these markets were used solely for buying and selling, with immediate payment and delivery. In 17th-century Japan, the Dōjima Rice Exchange introduced the concept of futures trading, and the Chicago Board of Trade (CBOT) expanded on this in 1864, creating the first standardized futures exchange.
Using a futures contract, a farmer could agree on a price for an upcoming harvest, thus locking it in and protecting themselves from price swings. A speculator would pay the money and agree to take delivery at a later date. If the price increased before that date, they could sell to other speculators and profit from the difference.
Spot and futures contracts still exist, accounting for a significant share of the market. But the global commodity market has since expanded and spans various contracts, including CFDs (contracts for difference).
With CFDs, the trader doesn’t take delivery of the underlying asset; they simply speculate on whether the price will increase or decrease.
How do commodity markets work?
Commodities are traded in either physical or virtual commodity markets.
In a physical commodity market, producers sell metals and energy resources, and farmers sell agricultural products, while suppliers and retailers buy what they need.
A virtual commodity market is more about speculation than physical goods. Market participants, including hedge funds, large speculators, and retail traders, use financial derivatives such as CFDs to speculate on price movements without taking delivery of the underlying asset.
As an individual trader, you can buy and hold resources like precious metals with the intent of selling them when the price increases. Alternatively, you can trade through a trusted broker like Exness to go long (buy) or short (sell), and profit from price increases/decreases without buying and holding physical assets.
When performing global commodity research to identify trends and trading opportunities, there are two main approaches: technical analysis and fundamental analysis.
How to conduct fundamental commodity market research
There are two main approaches to commodity market research:
A fundamental analysis examines supply and demand—the driving forces behind major market movements. As a key part of the global economy, the commodity market is heavily impacted by geopolitical events and economic news:
Events | Research methods | Adverse price effects | Positive price effects |
Inflation | National statistical agencies and labor organizations, such as the UK’s Office for National Statistics and the US Bureau of Labor Statistics (BLS). | Low inflation often leads to lower production costs, increased supply, and decreased demand. | Inflation increases the cost of labor and materials, making it more expensive to produce commodities. Many investors also consider commodities like precious metals to be a “hedge” in such times. |
Weather conditions | Crop reports like the Weekly Weather and Crop Bulletin and the World Agricultural Supply and Demand Estimates. | Adverse weather conditions and natural disasters can reduce crop yields, thus limiting supply and increasing prices. | Good weather leads to high-yield harvests. Agriculture thrives, markets are flooded, and prices drop. |
GDP | National statistical agencies like the Bureau of Economic Analysis in the US and Eurostat in the EU publish updated GDP data. | Weak GDP data suggest less industrial use of commodities and reduced consumption of the products they produce. | Strong GDP data signals a growing economy, leading to greater energy consumption and industry practices. |
Political instability | Breaking news channels and websites, as well as government websites. | Stable governments and global peace often lower commodity prices by improving trade relations and opening up supply lines. | Uprisings and war can disrupt supply lines while increasing oil demand. Prices increase as demand outweighs supply. |
A fundamental analyst may also explore inventory levels and study factors such as sustainability policies and eco-friendly fuel use. Ultimately, it all comes down to supply and demand, and they’ll look for any insights they can find to judge the current situation and future outlook.

How to conduct technical commodity market research
A significant price change doesn’t always have a clear, fundamental reason. Sometimes, the market panics when prices reach record highs. Other times, it moves with seasonal trends or because one trading session adopts a different sentiment than the next.
Technical commodity market research studies price charts to spot these trends and predict future movements. A technical trader will use their expertise to identify patterns in historical price data, while also looking for chart patterns that signal specific trends.
Technical traders often use indicators such as Bollinger Bands and moving averages to analyze price data.
For example, moving averages work by smoothing out price data over a given timeframe, making it easier to read and understand. If a trader then sees that a particular commodity has consistently traded above its average, they may see it as a sign of a significant uptrend and go long on that commodity.

What is the best commodities research?
There is no definitive way to trade commodities, but many experts believe that a combination of technical and fundamental analysis works best.
If we take gold as an example, you could spend some time studying short-term price charts to get an idea of market volatility. Trend lines will tell you which way the market is moving, and tools like Bollinger Bands and Relative Strength Index will indicate oversold/overbought conditions and give you an idea of volatility.
You can find trading opportunities on that information alone, but if you support it with technical analysis—checking economic data while reacting to breaking news—you could receive information that not only supports your decision, but indicates a more significant and longer-term trend.
How to trade commodity CFDs
Even the best commodities research will only get you so far. You need a trusted trading platform and a trading plan and strategy. If you’re new to commodities trading, start with an Exness demo account, where you can practice strategies, use risk-management tools, and trade in real market conditions without risking anything. See our guide to demo trading to learn more.
Exness is a regulated broker that holds licenses with numerous authorities across several jurisdictions, allowing you to focus on conducting commodity market research, knowing your financial security is protected.
We also offer numerous trading platforms, including the Exness Terminal, the Exness Trade app, MetaTrader 4, and MetaTrader 5.
Once your account is ready to go, follow these steps to start trading commodity CFDs:

1. Choose your commodity
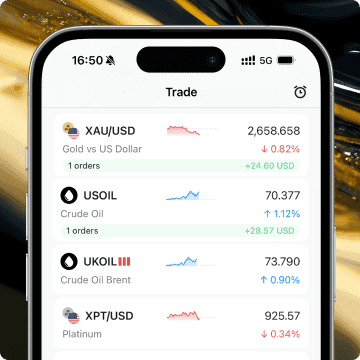
Exness offers various commodity trading options, all presented with a commodity symbol followed by a currency symbol.
For example, with XAUUSD, you’re trading gold against the US dollar, and the price of this asset represents the current spot price of an ounce of gold in US dollars. With XAGGBP, you’re trading silver in pound sterling, with the price representing the spot price of an ounce of silver in GBP.
The most popular commodities to trade are those with high liquidity and volatility, including both gold and silver, as well as crude oil (USOIL) and natural gas (XNGUSD). Stick with a few popular commodities to begin with, as it’s much easier to conduct commodity market research and find trading opportunities without getting overwhelmed.

2. Create a trading plan
Outline your entire approach to commodity trading in a clear and concise plan. Include your position sizing, which should be between 1% and 3% of your trading capital, note the strategy you will use, and include specific analytical tools and risk management strategies.
Writing everything down will focus your trading and give you a strong reference point for all future trades.
3. Choose your leverage
Using leverage, you can open larger positions than your balance allows. As a result, you’ll profit more if the market trends your way, but also stand to lose more if it does not.
If you place a 10 USD trade on XAUUSD with 1:100 leverage, you can potentially earn the same amount of profit as if you had invested 1,000 USD in that particular market. However, if the price movement works against you, you’ll lose the full 10 USD.
4. Conduct global commodity research
This is where your analytical skills come into play. Forecasting how the market will move is very difficult, so acquaint yourself with the main influencing factors (discussed above) and check the latest developments.
Consider everything from the state of the economy to geopolitical instability, natural disasters, extreme weather conditions, and inflation to determine whether prices will increase or decrease.
5. Record your trades in a journal
Keep a trading journal and document every trade. Include the dates and times you opened and closed, the profit/loss, the risk management tools, and any mitigating factors, such as an emotional impulse that caused you to pull out early.
If things aren’t going your way, you can consult your journal to see where they might be going wrong. You may find that you’re trading on emotion and even increasing exposure to chase losses. You may discover that you’re sticking to your plan, but the markets just haven’t moved as predicted.
Either way, you can tweak and even completely revamp your approach if needed.
6. Execute your trades
Choose whether you want to go “long” and buy the asset or go “short” and sell it. With the former, you profit if the value increases; with the latter, you profit when the value falls.
Make sure the value of the trade stays within your position sizing limits. So, if you have trading capital of 1,000 USD and a modest position size of 1%, that means you should risk no more than 10 USD during a single trade.
Set a stop loss order to prevent significant losses and a take profit order to close the position when it reaches your target profit.

Trading glossary
Commodity market A commodity market is a marketplace where raw materials like metals, energy, and agricultural products are bought and sold, either physically or through financial instruments.
Contracts for difference (CFDs) CFDs are financial derivatives that allow traders to speculate on price movements without owning the underlying asset, profiting from both rising and falling markets.
Fundamental analysis Fundamental analysis evaluates commodity prices by examining supply and demand factors, including economic data, geopolitical events, and environmental conditions.
Technical analysis Technical analysis involves studying historical price charts and using indicators to identify patterns, trends, and potential entry and exit points in the market.
Leverage Leverage allows traders to control larger positions with a smaller amount of capital, increasing both potential profits and potential losses.
Stop loss order A stop loss order is a risk management tool that automatically closes a trade at a predetermined price to limit potential losses.
Take profit order A take profit order automatically closes a trade when a specified profit level is reached, helping traders secure gains without constant monitoring.
The best oil pricing just got better
Save 69.4% on every USOil trade.
69.4% USOIL claim based on comparison of the average pricing in the last week of 05.2024 vs last week of 08.2025.
Final thoughts
Commodity markets play a vital role in the global economy, driving industries through the constant exchange of raw materials like gold, silver, wheat, and crude oil. By conducting thorough commodity market research, traders can better understand market dynamics, anticipate price movements, and uncover potential trading opportunities across different asset classes.
The best commodities research combines fundamental insights—such as economic data and geopolitical developments—with technical analysis of price charts and patterns. With a clear trading plan, proper risk management, and consistent review through a trading journal, traders can refine their approach and improve long-term performance.
Ready to put your knowledge into practice? Start risk-free with an Exness demo account and apply your commodity market research strategies in real market conditions:
Frequently asked questions
What is commodity market research, and why is it important?
Commodity market research involves analyzing supply, demand, and price trends to understand how commodities behave, helping traders make informed decisions and identify trading opportunities.
What is the best commodities research method for traders?
The best commodities research combines fundamental analysis (economic data and global events) with technical analysis (price charts and indicators) to provide a well-rounded market view.
How does global commodity research help predict market trends?
Global commodity research examines macroeconomic factors such as inflation, GDP, weather, and geopolitical events, enabling traders to anticipate price movements and adjust their strategies accordingly.
Share:
Related


Exness Trade app
Trade with confidence anytime, anywhere.


Get the app
App title

Trading is risky. T&Cs apply.


